A web-based shop diagnostics tool that can turn a shop owner into someone who can understand what is going in their business through the numbers.
Project Background
RPM Training helps shop owners understand their business and teaches them how to improve it. Shop owner's main struggle is understanding why their business is not performing as well as they would like to. Most of them run their business blind and are not sure how to turn their business around. Their main goal is to improve profits. This is where Freedom Training Consulting comes in. They help owners diagnose what parts of their business they can improve and how.
To help diagnose each shop, shop owners use an MS Excel spreadsheet. The spreadsheet allows them to enter monthly financial and shop performance data. It then calculates ratios and percentages which they compare against benchmarks and forecasts.
Challenges
The problem with the spreadsheet is that it’s quite daunting to use and not the most reliable due to the different versions of MS Excel. Furthermore, it’s not possible to total data or compare data across different years or to other shop owners. Because it is in Excel it is not a good collaboration tool and can’t handle large amounts of data well.
Goals
To create a collaborative, web-based tool that shop owners can use to diagnose problems and track progress. The diagnostics tools aimed to help owners make sense of their numbers and figure out which things to focus on so as to improve their productivity and profitability.
The new app’s goal was to make use of newer web technology to allow users to enter their monthly data quickly, view how their shop is doing and get smart recommendations. From a coaching point of view, the app can aggregate data and compare important KPIs across various shops and groups. This allows Freedom Training Consulting to carry out coaching sessions more effectively and with more information.
Solution
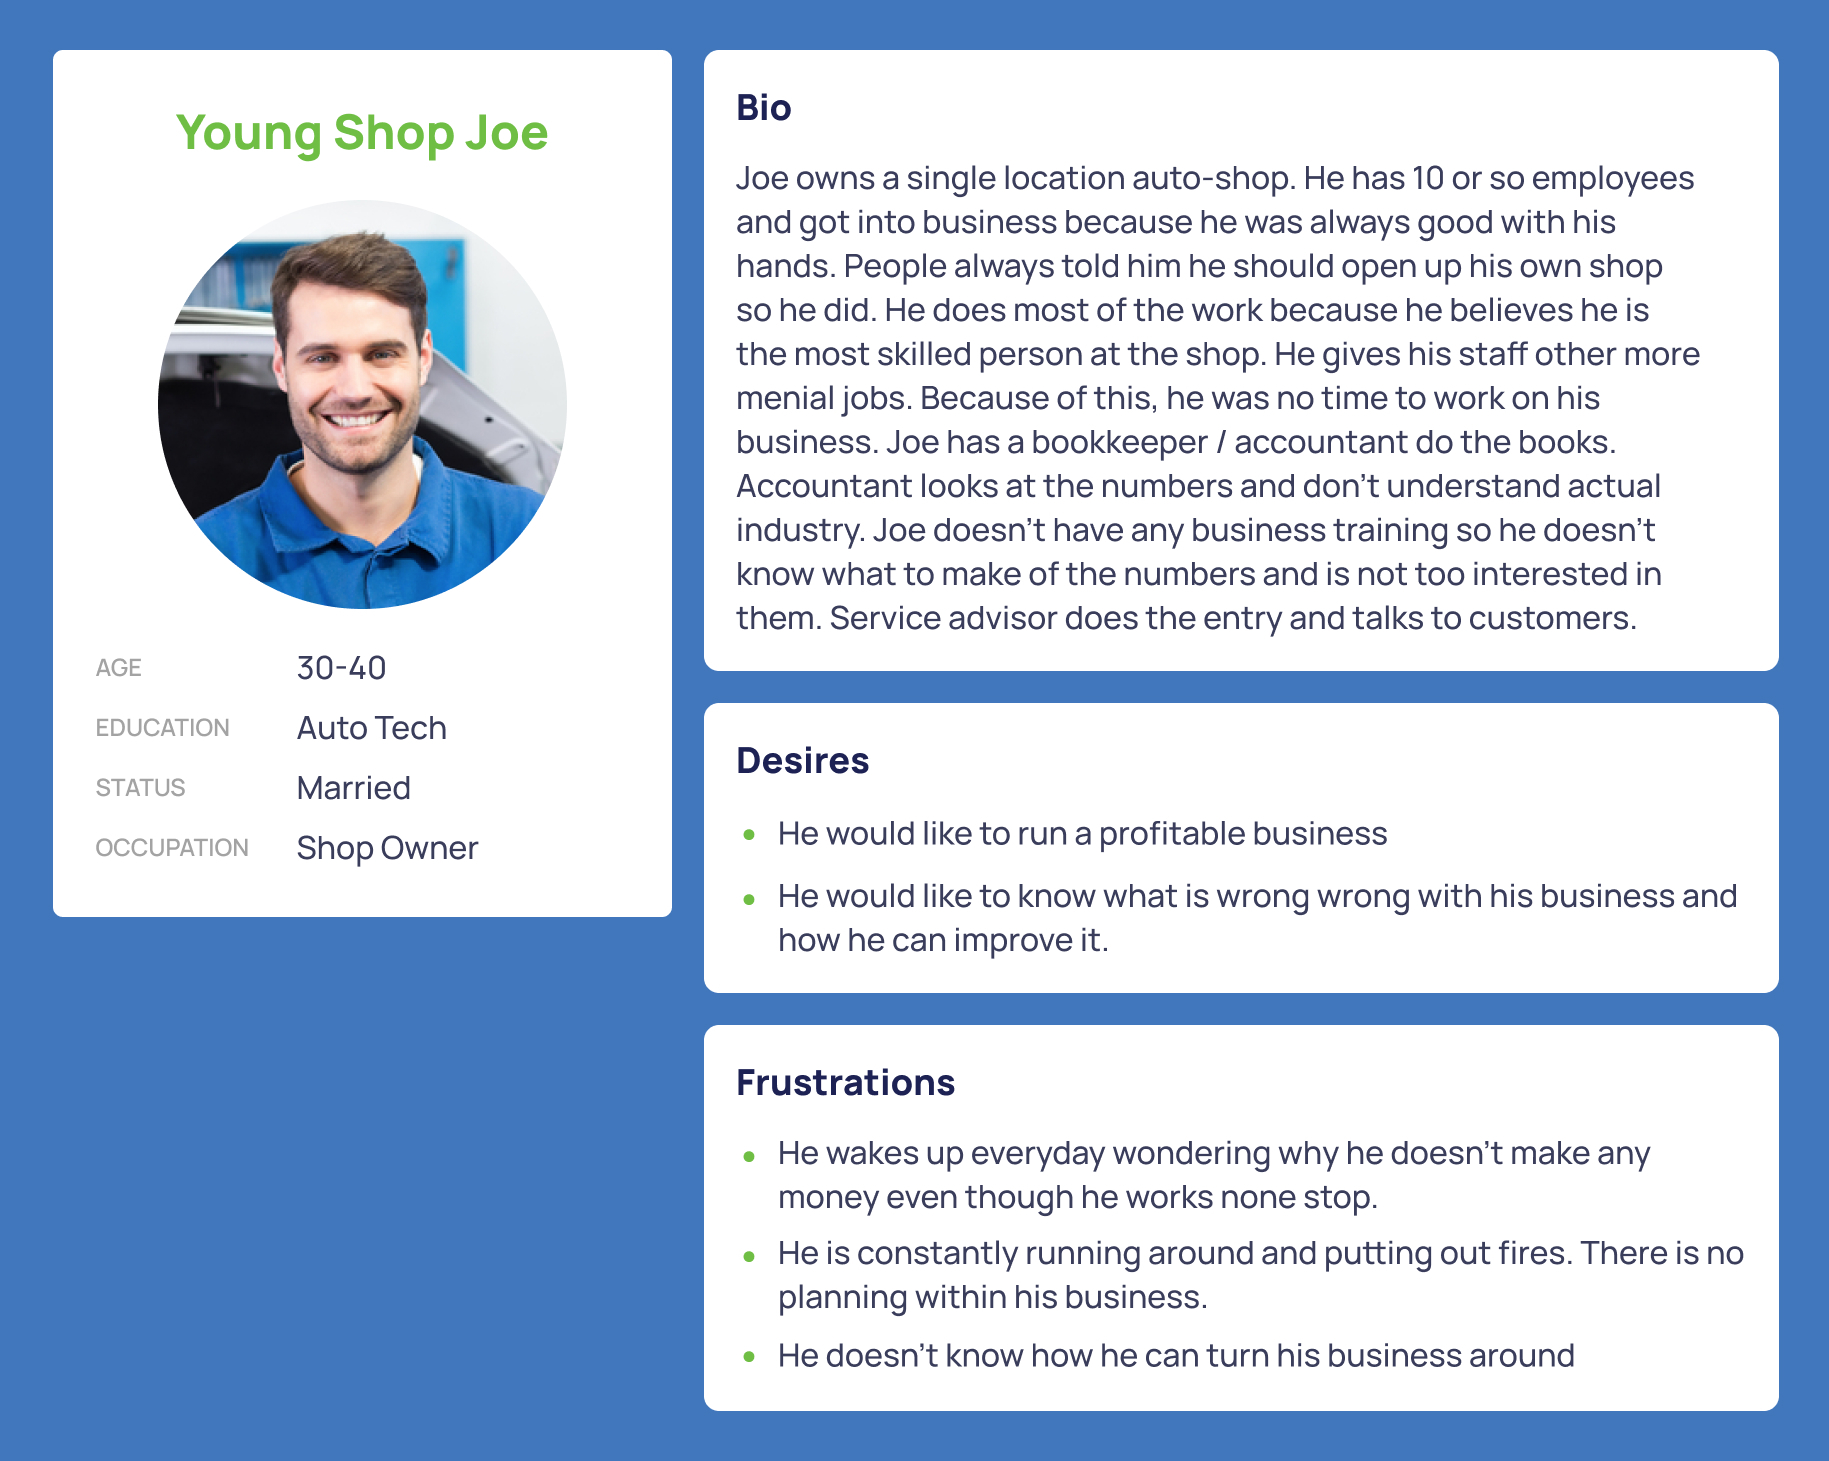
Personas
To create these personas we had in-depth conversations with our client. He shared the different types of shop owners he typically interacts with.
To ensure we fully understood these shop owners and their current issues, we conducted phone interviews. We asked them a series of questions about their shop, their problems, desires and their feelings towards the existing MS Excel solution. With this information in hand, we created the following personas.


Sketches and Wireframes
Designing sketches and low fidelity wireframes before finalizing the design saved a lot of the development times by giving a clear picture of how the screens looked and revealing design flaws early in the process. It also allows to iterate and improve on a concept much quicker.
For this project, we were using Angular's material design library which means we needed to design our screens following their design guidelines. This way we could fully leverage the library and not have to do extra work to design custom styles.

Sketching out a possible onboarding sequence.

Wireframes are great to help us define a user story and find any missing gaps that we might have missed!
Key Features
The key for this app to be successful was to make it super easy for shop owners to enter their monthly data. To do this, we designed a wizard that walks them through all the different steps. The original spreadsheet was very daunting and confusing. By breaking it up into steps, we simplified the process. It also gives us room to add more features and help in the future.

Another feature that came up from talking to our client and shop owners was the ability to customize/map expense accounts. Before, shop owners struggled to enter expenses because it was confusing and time-consuming. In their own accounting system, they were categorized one way but this tool expected them another way. To fix this issue, we allowed them to re-name and breakdown expense categories so they can replicate their own structure within the app. All the while still mapping to a generic expense template in the background so that expenses can be compared across shops. Now shop owners can export expense report from their accounting system and directly import them into the app without having to remember what goes where.

Lastly, the most important piece of the app - the analysis. Prior to this app being built the analysis page was a static Excel spreadsheet. Now it can compare data across the previous year and to a forecast. Now in realtime shop owners can compare to previous years and track how they are doing versus a forecast. Our aim for the Analysis page was to put the most important data right and center. We also wanted to give them the flexibility to dig into different KPIs and learn what affects them.

Results
The new app has given Freedom Training Consulting the ability to acquire more clients without having to grow. Now he is able to spend more time coaching, leveraging this new data and learning new ways to coach. Now more than ever this tool has become essential to their business. Prior to COVID-19 all of their coaching meetings were conducted in-person, but now everything is remote and this tool is one of the reasons their coaching sessions have continued to be successful.
